Performance indicators - Transportation Data and Information Hub
Archived Content
Information identified as archived is provided for reference, research or recordkeeping purposes. It is not subject to the Government of Canada Web Standards and has not been altered or updated since it was archived. Please "contact us" to request a format other than those available.
This table has been replaced by 23-10-0270-02 and 23-10-0271-02.
Catalogue number: Catalogue number: 50-502-X
Issue number: 2018003
Transportation system utilization and performance
-
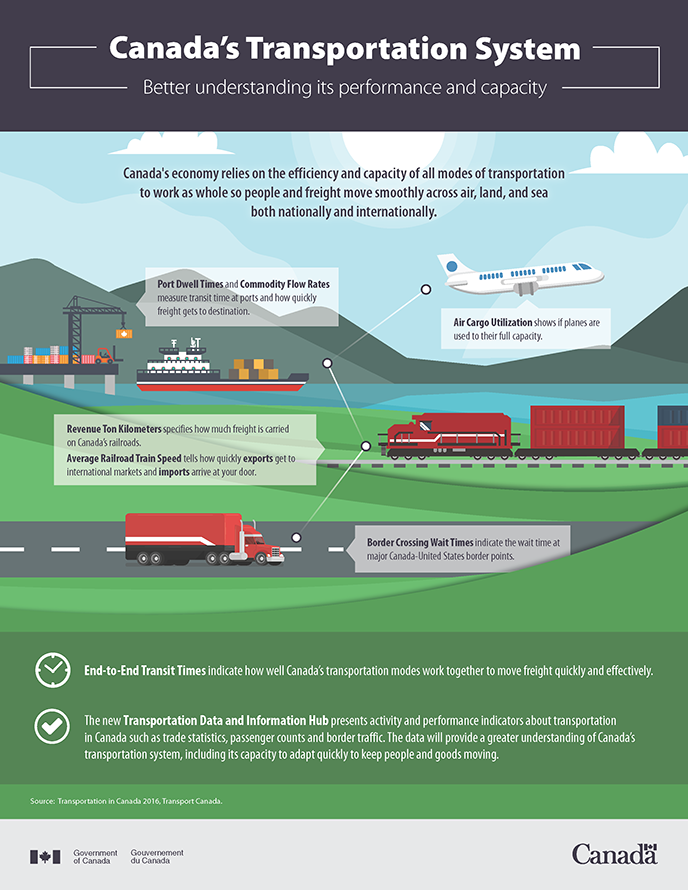
Air cargo utilization More information on Air cargo utilization
More indicators on Air cargo utilization
Air cargo utilization Toronto - London
December 2019
(12-month change)38%
-20.8%
Air cargo utilization Montréal - Paris
December 2019
(12-month change)34%
-19.0% -
Rail performance in North America, average weekly in month
More indicators on Rail performance in North America, average weekly in month
Rail performance Millions of revenue tonne-kilometres More information on Millions of revenue tonne-kilometres
March 2020
(12-month change)11,687 million
5.0%
Rail performance Carloads More information on Carloads
March 2020
(12-month change)160,213 cars
-2.9% -
Rail performance in Canada, average weekly in month
More indicators on Rail performance in Canada, average weekly in month
Rail performance Cars on line - System-wide More information on Cars on line - System-wide
March 2020
(12-month change)145,280 cars
-2.8%
Rail performance Number of Cars Unloaded at Western Ports - Grain Monitoring Program More information on Number of Cars Unloaded at Western Ports - Grain Monitoring Program
March 2020
(12-month change)29,318 cars
21.4%
Rail performance Average train speeds - averaged for all trains More information on Average train speeds - averaged for all trains
March 2020
(12-month change)38.3 km/h
7.9%
Rail performance Average train speeds - intermodal trains More information on Average train speeds - intermodal trains
March 2020
(12-month change)45.7 km/h
10.7% -
Border crossing median wait time for the month (for select crossing locations the time to cross into Canada and the United States) More information on Border crossing median wait time for the month (for select crossing locations the time to cross into Canada and the United States)
More indicators on Border crossing median wait time for the month (for select crossing locations the time to cross into Canada and the United States)
Border crossing median wait times St. Stephen, N.B.
March 2020
(12-month change)8.2 minutes
46.4%
Border crossing median wait times Woodstock, N.B.
March 2020
(12-month change)7.0 minutes
4.5%
Border crossing median wait times Rock Island, Que.
March 2020
(12-month change)7.6 minutes
-11.6%
Border crossing median wait times Lacolle, Que.
March 2020
(12-month change)9.5 minutes
-15.2%
Border crossing median wait times Lansdowne, Ont.
March 2020
(12-month change)11.8 minutes
-8.5%
Border crossing median wait times Niagara Falls/Queenston-Lewiston Bridge, Ont.
March 2020
(12-month change)10.6 minutes
-13.1%
Border crossing median wait times Fort Erie/Peace Bridge, Ont.
March 2020
(12-month change)14.6 minutes
16.8%
Border crossing median wait times Sarnia, Ont.
March 2020
(12-month change)11.6 minutes
-23.7%
Border crossing median wait times Windsor/Ambassador Bridge, Ont.
March 2020
(12-month change)11.5 minutes
-20.1%
Border crossing median wait times Sault Ste. Marie, Ont.
March 2020
(12-month change)6.1 minutes
-21.8%
Border crossing median wait times Emerson, Man.
March 2020
(12-month change)10.0 minutes
-3.8%
Border crossing median wait times North Portal, Sask.
March 2020
(12-month change)11.9 minutes
1.7%
Border crossing median wait times Coutts, Alta.
March 2020
(12-month change)12.2 minutes
-11.6%
Border crossing median wait times Huntingdon, B.C.
March 2020
(12-month change)9.2 minutes
-27.6%
Border crossing median wait times Pacific Highway, B.C.
March 2020
(12-month change)14.3 minutes
5.1%
Supply chain performance
Manufactured and intermodal
-
Containers - East Coast (Port of Halifax, Port of Montréal)
More indicators on Containers - East Coast (Port of Halifax, Port of Montréal)
Commodity flow indicator for Halifax More information on Commodity flow indicator for Halifax
March 2020
(12-month change)0.82
-26.1%
Commodity flow indicator for Montréal More information on Commodity flow indicator for Montréal
March 2020
(12-month change)1.03
-7.2%
Port dwell time East Coast ports More information on Port dwell time East Coast ports
March 2020
(12-month change)3.4 days
-30.6% -
Containers - West Coast (Port of Vancouver, Port of Prince Rupert)
More indicators on Containers - West Coast (Port of Vancouver, Port of Prince Rupert)
Commodity flow indicator for Vancouver More information on Commodity flow indicator for Vancouver
March 2020
(12-month change)0.92
-14.0%
Commodity flow indicator for Prince Rupert More information on Commodity flow indicator for Prince Rupert
March 2020
(12-month change)1.55
16.5%
Port dwell time West Coast ports More information on Port dwell time West Coast ports
March 2020
(12-month change)4.3 days
4.9%
End-to-end Shanghai-Toronto via West Coast ports More information on End-to-end Shanghai-Toronto via West Coast ports
March 2020
(12-month change)30.6 days
4.8%
Bulk commodities
-
Grain - West Coast
More indicators on Grain - West Coast
Commodity flow indicator for Vancouver More information on Commodity flow indicator for Vancouver
March 2020
(12-month change)1.19
22.7%
Commodity flow indicator for Prince Rupert More information on Commodity flow indicator for Prince Rupert
March 2020
(12-month change)0.95
-5.9%
End-to-end Saskatchewan to Japan via Vancouver More information on End-to-end Saskatchewan to Japan via Vancouver
March 2020
(12-month change)35.6 days
-5.3%
End-to-end Saskatchewan to China via Vancouver More information on End-to-end Saskatchewan to China via Vancouver
March 2020
(12-month change)42.7 days
0.7%
- Date modified:
